Usage
The primary purpose of the quantaq-cli is to make it easier for you - the user - to munge and analyze your sensor data. A quick overview of the available functions are below, with more detailed documentation on their complete functionality in the API Reference.
concat enables you to concatenate large groups of files together into one
merge allows you to combine a number of files together based on their timestamp
resample helps you up- or down-sample your data
expunge sets all flagged data to NaN’s
flag allows you to drop rows based on specific criteria or statistical methods (coming soon)
Overview of Available Commands
Concatenate Files
The purpose of this command is to take a bunch of files of the same type and concatenate them together. To use, you must provide either a list of files or a wildcard argument that will glob all of the files together. FILES is the only required argument, as can be seen in the API Reference.
Below is an example of a wildcard argument that will grab all files in the directory that begin with data and are .csv’s. We would expect this command to concatenate all of those files and output them to path/output.csv. Additionally, the verbosity flag has been set (-v) which will print out additional debugging information to the console.
$ quantaq-cli concat -v -o path/output.csv path/data*.csv
If you wanted to explicitly define the individual files to concatenate, you can do that as well:
$ quantaq-cli concat -v path/file-1.csv path/file-2.csv
This time, we didn’t define the output path (-o), so the default will be used which will save the file to your current working directory.
Additionally, there is support for concatenating files from the on-board µSD card log files which are fairly hard-to-parse txt files with a ton of embedded information. By adding the -l, –logs flag, you can easily convert the entire directory to a single csv file that is usable and makes sense!
$ quantaq-cli concat -v -l -o final-logs.csv path/to/logs/*.txt
Warning
Arguments must come at the end of the command. For this CLI, this usually means the filepath for the files being read in. However, you can always check the API Reference for complete documentation.
Merge Files
Often times, there is a need to merge two (or more) files on their timestamp. For example, if we have raw and final data files (or sensor data and reference station data), we need to merge them into a single file to make analysis easier. We can leverage the merge command to easily accomplish this. The only required argument is the file(s) to merge together. Additionally, you can override the name of the timestamp column (-ts, –tscol) as well as define the output file destination (-o, –output).
To merge together two files with the default timestamp column and output destination:
$ quantaq-cli merge -v path/file-1.csv path/file-2.csv
If we want to go ahead and override the timestamp column to one named tstamp:
$ quantaq-cli merge -v -ts tstamp path/file-1.csv path/file-2.csv
If we want to override the output file destination:
$ quantaq-cli merge -v -o dest-path/final-file.csv path/file-1.csv path/file-2.csv
Warning
The timestamp column name must be the same in all files.
Flag Data
While all raw data files contain a flag column, the flag command provides an easy way to set additional flags. This method WILL NOT remove the data, but it will set a flag that can be removed with the expunge command detailed below. There are four required arguments: the file path, the column name, the comparator, and the value. Additionally, you can set the device model using the model keyword argument. The goal is to make it easy to flag all data that falls outside some threshold range based on your domain knowledge and intuition. The column must be named identically to a column in the file otherwise an exception will be raised.
The comparators that can be chosen/used are:
lt : less than ( < )
le : less than or equal to ( <= )
eq : equals ( == )
gt : greater than ( > )
ge : greater than or equal to ( >= )
In addition to the required arguments, there are a few optional arguments that can be used inlcuding the verbosity (-v, –verbosity) and output (-o, –output) flags prevelant throughout this library. Last is the flag (-f, –flag) option. The flag option allows you to set the flag that is used where the default is the FLAG_ROW flag which will NaN the entire row of data. Flags are specific to each sensor and you should look up the options for your sensor in the sensors documentation. However, there are several flags that can be used and are (as of June 2020) the same for all sensors:
FLAG_OPC will NaN all particle data
FLAG_CO will NaN all CO data
FLAG_CO2 will NaN all CO2 data
FLAG_NO will NaN all NO data
FLAG_NO2 will NaN all NO2 data
FLAG_O3 will NaN all O3 data
FLAG_NEPH will NaN all nephelometer data (MODULAIR-PM only)
FLAG_RHTP will NaN all relative humidity, temp., and pressure data (MODULAIR-PM only)
Examples:
If we want to flag all rows where the co_ae column is less than 500 mV:
$ quantaq-cli flag -v file-1.csv co_ae lt 500
If we want to eliminate only the CO data with the same conditions, we would need to just change the flag we want to use:
$ quantaq-cli flag -v -f FLAG_CO file-1.csv co_ae lt 500
It is quite possible that you will want to use multiple filters but only save one file. The flag command only allows one set of commands at a time for now, but you can easily accomplish this by using the previous output file path as the input to the second command. Here, we filter out the entire row where co_ae is either less than 500 mV or greater than 3300 mV:
$ quantaq-cli flag -v -o output.csv file-1.csv co_ae lt 500
$ quantaq-cli flag -v -o final.csv output.csv co_ae gt 3300
Using this approach, complex workflows can be built.
Note
There are plans to support various statistical methods for flagging outliers. If you have recomendations or thoughts, please add an issue to the GitHub repository.
Expunge Data
All raw data files have a flag column that contains a single integer with several flag values combined as a bitmask. To clean this data, we use the expunge command. When we say clean, what we mean is that the columns associated with a given flag are set to NaN’s whenever that flag is set. For more information on the sensor-specific flags, please check out your sensors documentation.
There are a few additional options available for this command including -d, –dry-run which will generate the flag report and print it out to the terminal screen without saving the final data file, as well as the same -o, –output flag to define the output file path as in other commands. The model of the device you are trying to flag can be set with the -m, –model flag where the available options are [v100, v200, and modulair_pm]. Last, if you are using your own files and have renamed the flag column, you can overrride the name of that column with the -f, –flag option.
If you running with the verbose flag set (-v, –verbose) or with the dry-run (-d, –dry-run) flag set, a table with the flag report will be output to the terminal screen.
For example, we can run the default expunge command in dry-run mode:
$ quantaq-cli expunge --dry-run -m v200 path/file-1.csv
When you run this, you will see a report generated which will look something like:
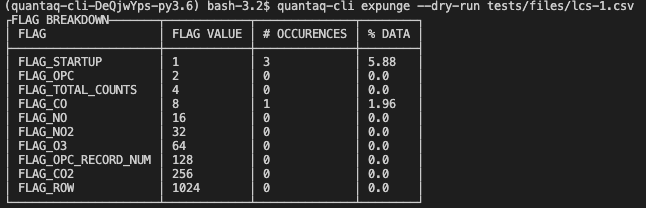
It contains the name of each possible flag, the flag’s value, the number of occurences, and the percentage of time the flag was set.
To run normally with all defaults:
$ quantaq-cli expunge -v -m v200 path/file-1.csv
Resample Data
The resample command makes it easy to up- or down-sample your data (e.g., converting your secondly data into 5-minutely data). The only required columns are the FILE and the INTERVAL. The INTERVAL should be a string that contains both the number and sampling interval, where available sampling interval definitions are below:
M : month
W : week
d: day
h : hour
min : minute
s : second
ms: millisecond
So, if you wanted to resample your data from 1-second frequency to 5-minute frequency, your INTERVAL would be 5min.
In addition to required arguments, there are a few options including the method (-m, –method) and the tscol (-ts, –tscol). The tscol allows you to override the name of the timestamp column which is timestamp by default. The method column allows you to override the method by which you resample, which defaults to mean. Available options for method are mean, median, sum, min, and max.
Now, for some examples!
If we want to take our data file which is at 10-second frequency and output a file that is 5-minute averaged:
$ quantaq-cli resample -v path/file-1.csv 5min
If we want to do the same, but get the median of each 5-min interval instead of the mean:
$ quantaq-cli resample -v -m median path/file-1.csv 5min
What if we have a different timestamp colum named col_time and want the 24 hour average?
$ quantaq-cli resample -v -ts col_time path/file-1.csv 24h
Warning
When resampling your data, any non-numeric columns will be dropped.
Playbook
Note
Feather-format data. Feather is a fast, lightweight, easy-to-use binary file format for storing data frames that is programming-language agnostic and extremely efficient when working with time-series data. The process of converting string to python datetime objects is fairly inefficient, especially for large data files. Thus, if working with large files and you desire to manipulate time-series data, it is highly recommended that you use the feather file format!
This is supported by this CLI by simply defining the output file with a file extension that is .feather.
This playbook contains an example of a common workflow for QuantAQ users - you have a ton of raw and final data files, and you need to concatenate them, merge them together, and then expunge them. We will also throw in a few optional flagging steps just to show you how it could be incorporated. This entire workflow could be automated using a tool such as Snakemake or via bespoke bash commands/files.
How to munge and clean your data
First, we will assume there is some directory containing all files with two subdirectories called raw and final. Additionally, we have an extra folder to hold our munged data:
dir/
dir/raw/*
dir/final/*
dir/munged/
We begin by concatenating together all raw files into a single file called dir/munged/concat-raw.feather and do the same for the final data files and save to dir/munged/concat-final.feather. We assume that all files in the respective directories are csv’s and we are using all of them.
$ quantaq-cli concat -v -o dir/munged/concat-raw.feather dir/raw/*.csv
$ quantaq-cli concat -v -o dir/munged/concat-final.feather \
                dir/final/*.csv
At this point, we have two large files. Next, we will merge the two files together into a single file called dir/munged/merged.feather:
$ quantaq-cli merge -v -o dir/munged/merged.feather \
        dir/munged/concat-raw.feather dir/munged/concat-final.feather
Next, let’s (optionally) flag the data based on temperature to throw out any periods that have truly ridiculous values (which likely means the sensor was misbehaving):
$ quantaq-cli flag -v -o dir/munged/tmp.feather dir/munged/merged.feather \
        temp_manifold ge 100
Next, we will expunge the data and set the flagged data to NaN’s:
$ quantaq-cli expunge -v -o dir/munged/expunged.feather dir/munged/tmp.feather
At this point, we could stop as we have a file (expunged.feather) that contains the final, de-flagged data. However, it is likely still at a 10-second sample frequency which is a lot of data! Let’s go ahead and resample it to both 1min and 5min intervals:
$ quantaq-cli resample -v -o dir/munged/final-1min.csv dir/expunged.feather 1min
$ quantaq-cli resample -v -o dir/munged/final-5min.csv dir/expunged.feather 5min
And that’s it! Just ~7 bash commands and you’ve gone from two directories full of data to 2 files that contain the final 1min and 5min sampled data!